| From: Bethkanter.org |
Information graphics or Infographics are defined by Wkipedia as:
"...graphic visual representations of information, data, or knowledge intended to present complex information quickly and clearly. They can improve cognition by utilizing graphics to enhance the human visual system's ability to see patterns and trends."
History or Infographics:
It's not that infographics are new, they've been around for a long time. Subway maps, weather maps, site plans, and graphs have been used for many years to visually relay weather paths, trends, and statistical data. Some might even date the first infographics to cave paintings and hieroglyphics. What is different now is the proliferation of free tools and social media websites that empower all of us to relay, send, and resend information quickly and efficiently, as well as proliferation of data detailing the effectiveness of visual images over verbal messages in terms of decoding speed, comprehension, and memory.
According to Wikipedia (http://en.wikipedia.org/wiki/Infographic):
"The infographics created by Peter Sullivan for The Sunday Times in the 1970's, 1980's, and 1990's were some of the key factors in encouraging newspapers to use more infographics...Likewise the staff artists at USA Today...established the goal of using graphics to make information easier to comprehend.
By the year 2000, Adobe Flash-based animations on the internet had made use of many key practices in creating infographics in order to create a variety of products and games. Likewise, television began to incorporate infographics...[and] Kelly Shelton has widely been credited with the modern re-introduction of the infographic for marketing purposes. With the rise of alternatives to Adobe Flash, such as HTML 5 and CSS3, infographics are now created in a variety of media with a number of software tools.
Infographics are effective because of their visual element...Fifty percent of the human brain is dedicated to visual functions and images are processed faster than text...Furthermore, it is estimated that 65% of the population are visual learners (as opposed to auditory or kinesthetic), so the visual nature of infographics caters to a large portion of the population.Infographics 101:
According to Wikipedia, there are essentially three components to infographics: visual, content, and knowledge.
The visual component consists of use of color, fonts, icons, and graphic design.
The content of infographics typically consists of facts, research data and statistics.
The knowledge typically involves some insight or perspective relating to the data being presented.
Furthermore, the Wikipedia cites "three basic provisions of communication" that need to be considered and integrated when designing an infographic: appeal (it needs to engage its audience), comprehension (its information must be simply relayed to be quickly and easily understood), and retention (it should simply relayed and distinctly presented to be easily incorporated and remembered).
Interestingly and equally essential to effective communication, Aristotle noted three other vital aspects that should be incorporated into any message of persuasion: ethos, logos, and pathos.
Ethos refers to the credibility of the message and messenger. In order to be considered, there should be some reference to a reputable or known source.
Logos - for any communication wanting serious consideration, it must sound/look/appear to be logical or rational.
Pathos - the content of the message has to appeal to the emotional passions of its viewers.
While I have not (yet) endeavored to create my own infographics, in searching and researching infographics I found the following tools and websites to help create infographics:
- Infographic Basics
- Inforgraphics Showcase is an awesome resource for a wide array of inforgraphic collections on the web.
- Cool Infographics is an awesome site that collects and chronicles infographics from all over the web, covering all kinds of topics.
- InforgraphicsMaze.com reviews and grades inforgraphics for design, creativity and information and is an interesting resource to use when either thinking of your own infographic or trying to analyze someone.
- Inforgraphic Design provides "The Ultimate Beginner's Guide to Infographic Marketing
- http://www.seomoz.org/blog/10-tools-for-creating-infographics-visualizations
- http://www.hongkiat.com/blog/infographic-tools/
- http://www.infographicsarchive.com/create-infographics-and-data-visualization/
- http://blog.crazyegg.com/2012/12/28/how-to-create-infographics/
- http://www.makeuseof.com/tag/10-of-the-best-tools-for-creating-infographics/
- How to select the right color for the right message
Seven AWESOME examples of education-related infographics:
If you've been following or have visited my blog in the past, you may recall three other awesome infographics I've posted, one on the changing use of grammar by kids today The Ghost of Grammar Past, the importance of recess and its use and misuse in schools Good Grief 20 Minute Lunces and No Recess? and the other on Internet safety, Internet Safety for Kids: Growing Up in the Information Age.
But, here are a few more:
Here is an infographic found at http://visual.ly/k-12-technology-usage using data from 2011-2012 on the use of digital tools and technology in used K-12 classrooms:

This next infographic was found at http://www.adhdinfographic.com/ and visually relays information about ADHD:

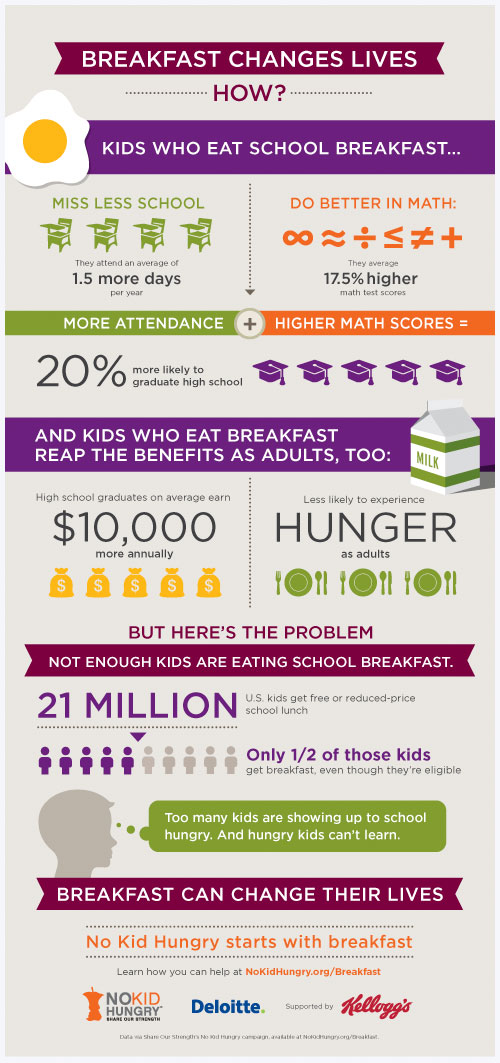
I found a number of infographics on the importance of breakfast but liked the one below best in terms of both graphics and content. While I found it at http://pinterest.com/pin/48202658483896059/ I could not find the link to who created it.
For those interested in the future of libraries, Open-Site.org created the following infographic (which I found at http://www.mediabistro.com/appnewser/the-future-of-libraries-infographic_b31564):

Here is another really neat infographic detailing English word use and misuse. It was developed by Grammar.net in 2011 and I found it at http://www.bitrebels.com/lifestyle/10-commonly-misunderstood-words/

The next infographic relays how 21st century learning is changing (found at: http://www.educatorstechnology.com/2013/02/cool-gr

The last infographic is from https://dl.dropbox.com/u/3138780/padwheel/assets/fallback/index.html developed by Allan Carrington (University of Adelaide and first discovered on the website of Paul Hopkin's educational consultancy website mmiweb.org.uk). It illustrates how different apps can be used at home or school to teach and enhance how to create, remember, understand, apply, analyze, and evaluate:

These were some of the infographics that spoke to me. I hope they spoke to you too. Feel free to leave links to your favorite infographics and/or comments about your experiences creating and using them.
Thank you for your visit and please leave a remark in the comments.


